 |
|
|
Animation of a 24-hour simulation of the atmospheric COSMO-model for May 12th, 2008, on a high horizontal grid-resolution of 400m. The animation shows the surface temperature mapped onto the relief (view from the south, with the Eifel low mountain range in the south and the Rhine river valley running from south to north). The vertical cross section through the atmosphere shows the specific humidity.
|
|

 Specific humidity in kg/kg
 Surface temperature in Kelvin
|
|
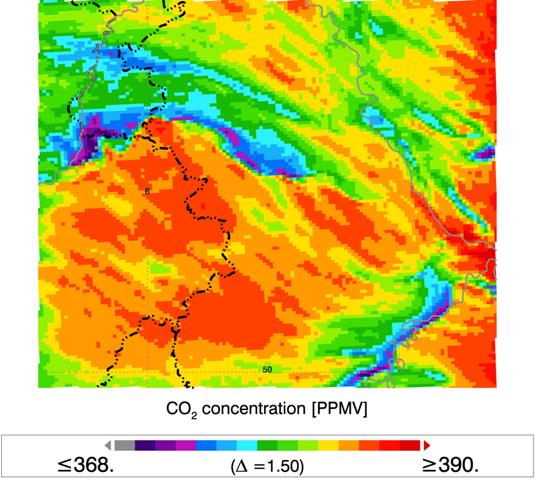
CO2 concentration in the lower atmosphere with TerrSysMP including CO2 fluxes (08 May 2008, 09 UTC)
|
|
|
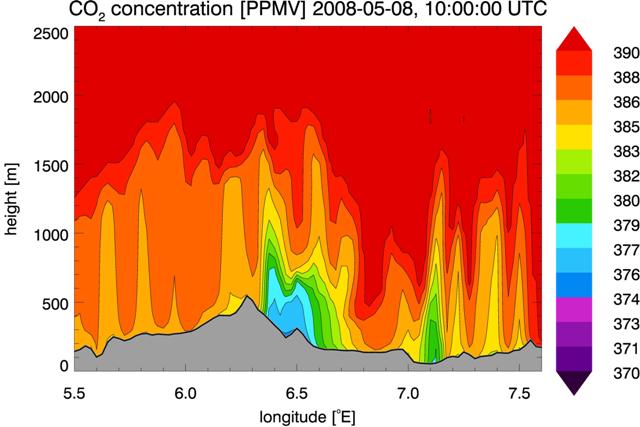
Vertical cross-section of CO2 in the PBL, simulated with TerrSysMP |